


扫描点数高达40001
更多的扫描点可以提供更高的分辨率,捕捉更多不易发现的信号

高扫描点数显现更佳测量效果
精准捕捉扫频信号,完整呈现扫频过程

8种高级测量
-通道功率
-时域功率
-占用带宽
-三阶交调
-邻道功率
-频谱监测
-载噪比
-谐波

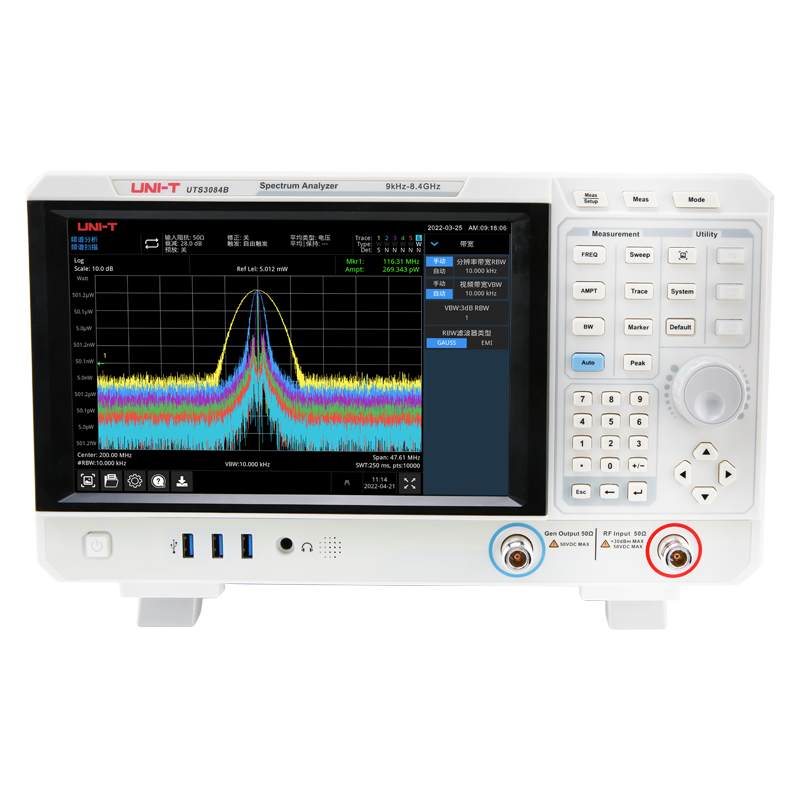
6条多彩迹线
通过不同颜色的迹线清晰观察比较改变RBW或检波方式后的频谱变化,多纬度观测信号

优异的相噪
-98 dBc/Hz@1 GHz,10 kHz offset,轻松测量更高速、抖动更低的时钟源信号

多种检波方式
提供正峰,负峰,采样,标准,平均,准峰等多种检波方式,层层筛选,便于分析不同类型的信号

选择性<4.8:1
更好区分邻近频率

瀑布图
可以直观的查看指定频域内各频点的功率分量

激活选件分析
-高级测量选件(AMK)
-跟踪源选件(TG)
-模拟解调分析选件(AMA)
-数字解调分析选件(VSA)
-EMI测量选件(EMI)
专业、深入、全面

EMI测试应用
内建CISPR带宽和检测器
自动扫描多个段
限制线和自动峰值/限制搜索
使用不同检测器的最多3条迹线
记录频率显示
使用三个检测器在标记或感兴趣的信号上进行实时测量

帮助菜单内含SCPI
方便用户进行二次开发控制